Impact of goverment policies for reducing infection rate of COVID-19 in the US
Tuesday, December 29, 2020
Posted by Tushar Nitave, College of Computing, Illinois Tech, Chicago
Collaborators: Tushar Nitave and Naunidh Singh
image source: Simulation tool developed by Tushar Nitave and Naunidh Singh
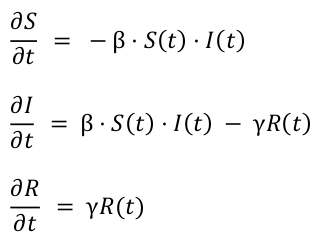
In this research project our aim was to evaluate the efficiency of the policies enforced by the government of the United States for controlling the spread of COVID-19. Government enforced roughly 18 policies (read more) which includes school closure, travel restrictions, social distancing, mask mandate etc. Generally, in order to measure the spread of virus during epidemics and pandemics a Susceptible-Infected-Recovered (SIR) model is used. The following figure shows the equations for the basic SIR model which uses the susceptible, infected & recovered count to measure the spread of virus in any country or region.
Our research was to project increase/decrease in the count of infections after a specific policy was enforced. Along with this we also consider the acceptiablity(%) of a specific policy by the people. In other words how likely people are going to follow the policies enforced by the government. For instance, if government enforces mask mandate by 100% and only half of the population follows it has 50% acceptiablity.
We used various sources to acquire the necessary data for this project. The data related to policy enforcement and people's acceptability to wear mask was provided by C3.ai. New York Times provided the data about mask usage at county level. We also used mobility data provided by Google which tracks movements of community at public places like grocery stores, pharmacies, parks etc.
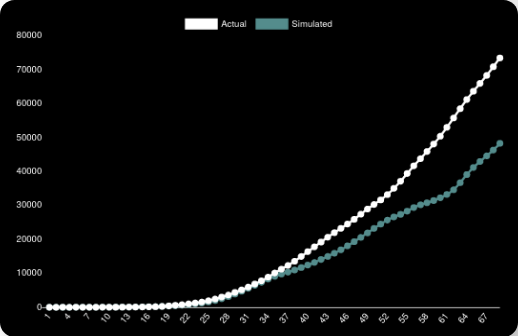
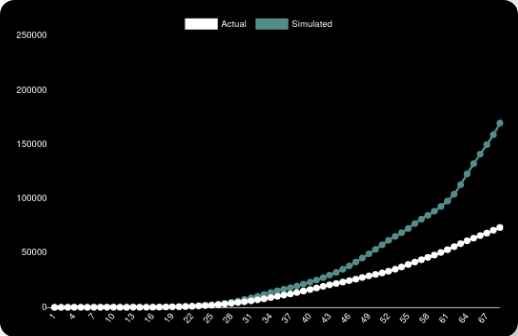
Fig. 1 White line shows the actual number of positive cases and green line shows the simulated count if people follow social distancing with 85% acceptability rate for the state of Illinois.
Fig. 2 White line shows the actual number of positive cases and green line shows the simulated count if people follow social distancing with 55% acceptability rate for the state of Illinois.
We ran multiple simulations with various parameter selections to see how the number of positive cases varies. In figure 1 we can see that the actual number of postive cases lies appoximately near 70K which is shown by white dotted line. On the other hand the green dotted line shows the number of positive cases in the scenario where the acceptability of social distance was set to 85%. In the latter case the count decreases nearly to 50K which is 20K less than the actual count. In figure 2 while actual count remains same as that of figure 1 we set the acceptability of social distance to 55% and as expected the number of positive cases increases to 150K+. This simulations in figure 1 and figure 2 represent the state of Illinois. It is clear that following social distance is indeed a great factor in reducing the count of positive cases.
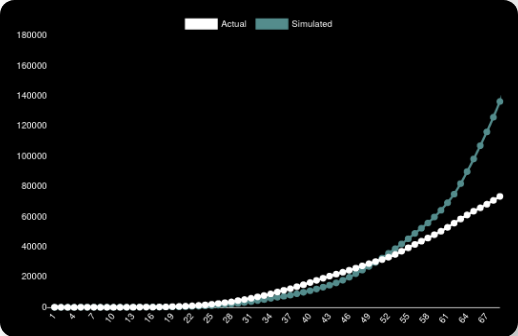
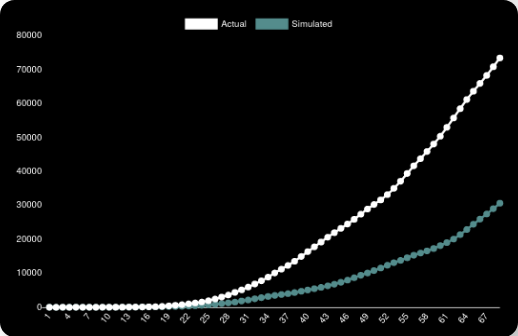
Fig. 3 White line shows the actual number of positive cases and green line shows the simulated count if people go to work place at the rate of 85%.
Fig. 4 White line shows the actual number of positive cases and green line shows the simulated count if people go to work place at the rate of 55%.
Next, we wanted to check the effect of people going to work place on the count of positive cases. The figure 3 shows the actual count of postive cases along with the count of positive cases when the willingness of people to go to work place was set to 85%. On the other hand figure 4 shows the actual count along with the count of positive cases when the willingness of people to go to work place was set to 55%. Naturally, in the latter case the count of positive cases is less.
From this research we can conclude that the policies enforced by the government such as social distance, work-from-home etc. have significant effect in controlling the spread of virus caused by SARS-Cov-2.